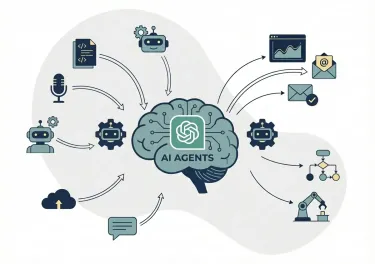
Integrate ChatGPT into your business with Scorchsoft's AI app development. Enhance capabilities, automation, and personalisation with AI tools like GPT, Bard, and Claude.
We can develop rich data dashboards and reports for apps and online portals. UK Data Dashboard App Developers.
At Scorchsoft, our expertise lies in crafting applications and portals that feature dynamic digital reports, including charts and graphs, to provide insightful and actionable metrics critical to your application's success.
Understanding the importance of insights and metrics in today's digital landscape, we ensure your ability to track and analyse your data through interactive charts, graphs, and widgets. Our aim is to transform your data into a powerful tool for decision-making, enhancing your application's value and your business's performance.
Our approach to data dashboard and report development focuses on delivering actionable insights. We go beyond merely presenting data; we analyse and interpret it to ensure it serves your strategic objectives. From tracking how users interact with your application to measuring the efficiency of connected devices, our solutions provide a holistic view of your operational landscape.
By integrating comprehensive analytics, you gain the ability to monitor progress towards your goals, using metrics that reflect real value and impact on your business. This focus on relevance and measurability empowers you to make data-driven decisions with confidence, ensuring your strategies are aligned with your business objectives.
We believe that the power of data comes from its ability to inform and persuade. To achieve this, data must be presented in a clear and comprehensible manner. Our dashboards are designed with this principle in mind, transforming complex datasets into visually engaging reports that instantly convey the key messages behind the numbers.
This clarity is invaluable when sharing insights with stakeholders, enabling discussions that are grounded in concrete evidence. By making data accessible to everyone, regardless of their technical background, we bridge the gap between data science and business strategy, facilitating a common understanding and fostering a data-centric culture within your organisation.
Our dashboards can be built to support the need for agility, offering advanced filtering options that allow users to drill down into specific data segments. Whether you're looking to analyse trends over time, assess the performance of different departments or products, or understand user behaviour patterns, our interactive tools make it easy.
By enabling users to customise their view of the data, we provide a more nuanced understanding of the factors driving your business's performance. This interactivity not only enhances user engagement but also encourages a more thorough exploration of your data, uncovering insights that might otherwise remain hidden.
Unlock the full potential of your data with Scorchsoft's bespoke dashboard solutions. Contact us to transform your data into actionable insights that drive decision-making and propel your business forward.
We would love to hear about your project. Please contact us, and share your goals; we'll respond with our thoughts and a rough cost estimate.
Scorchsoft is a UK-based team of web and mobile app developers and designers. We operate in-house from Birmingham, and our offices are located in the heart of the Jewellery Quarter.
Scorchsoft develops online portals, applications, web apps, and mobile app projects. With over fifteen years experience working with hundreds of small, medium, and large enterprises, in a diverse range of sectors, we'd love to discover how we can apply our expertise to your project.


